

Key Takeaways
Option A
Whole Foods
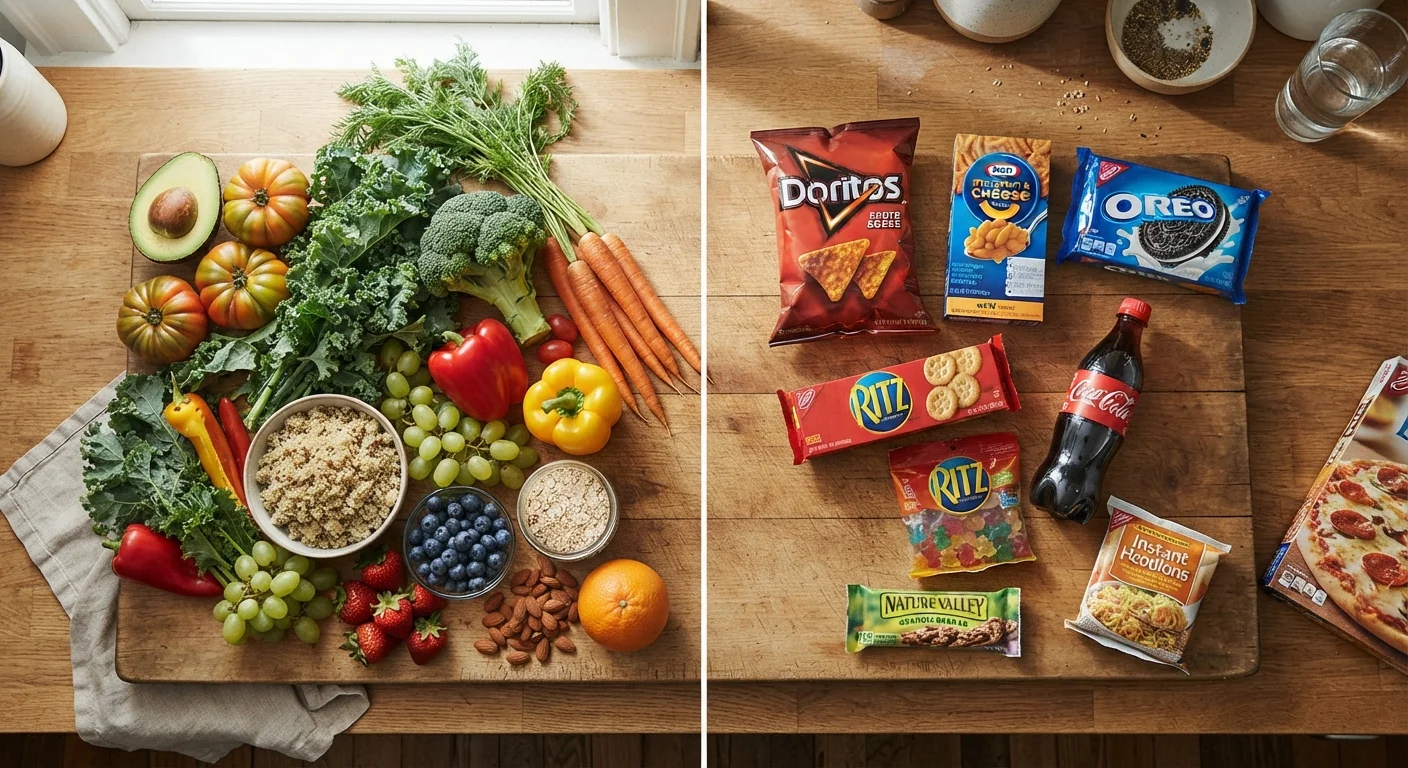
Foods in their natural or minimally altered state.
Best for: People seeking nutrient density, fiber, and minimal additives as the foundation of their diet.
Option B
Processed Foods
A broad category spanning lightly prepared to heavily manufactured foods.
Best for: Understanding context: some processing is harmless or beneficial; ultra-processing is where health concerns concentrate.
If your goal is maximum nutrient density and fiber intake
Whole Foods
Whole foods consistently deliver more fiber, vitamins, minerals, and beneficial phytonutrients with no added sugar, sodium, or synthetic additives.
If you need convenience without sacrificing nutrition
Minimally Processed Foods
Items like plain frozen vegetables, canned legumes, and pasteurized dairy retain most nutrients and fit easily into a busy schedule.
If you are managing a chronic condition or cardiovascular risk
Whole Foods
Research consistently associates diets centered on whole foods with better cardiometabolic markers; consult your healthcare provider for personalized guidance.
If you are evaluating whether a specific packaged food is acceptable
Processed Foods (with scrutiny)
Read the ingredient list and nutrition panel. A short list of recognizable ingredients often signals a less-processed product that can fit a balanced diet.
Why the Whole vs. Processed Label Oversimplifies Things
Ask most people what a 'processed food' is and they will picture a vending machine snack. In reality, processing is an umbrella term covering everything from washing spinach to manufacturing a cheese-flavored puff. That wide range is exactly why blanket rules — 'avoid all processed foods' — are hard to act on and can even misdirect well-intentioned eaters.
Nutritionists and researchers have developed classification tools to bring more precision to the conversation. The most widely cited is the NOVA classification, developed by researchers at the University of São Paulo. NOVA groups foods into four levels based on the extent and purpose of industrial processing — not simply on nutrient content alone.
Understanding where a food falls on that spectrum is far more useful than a binary label. It also explains why a bag of plain frozen peas and a bag of cheese-flavored crackers are both technically 'processed' yet occupy very different nutritional territory.
Processing Is Not Inherently Harmful
Pasteurization makes milk safe to drink. Freezing locks in nutrients that would otherwise degrade. Fermentation creates probiotics in yogurt. These are all forms of processing with well-established benefits. The health concerns in nutrition research focus specifically on ultra-processed products — Group 4 in the NOVA framework — not on processing as a whole. Keeping that distinction clear prevents unnecessary food fear and helps you make practical, informed choices.
The NOVA Spectrum: Four Groups Explained
Group 1 — Unprocessed or minimally processed foods: These are foods in their natural state or altered only to remove inedible parts, dry, freeze, or pasteurize. Fresh fruit, plain oats, eggs, unsalted nuts, and frozen vegetables with no added ingredients all fall here. Nutritional value is largely preserved.
Group 2 — Processed culinary ingredients: Substances extracted from whole foods — oils, butter, flour, sugar, salt — used in home cooking. These are not typically eaten alone but enable us to prepare Group 1 foods into meals.
Group 3 — Processed foods: Products made by adding Group 2 ingredients to Group 1 foods, primarily to extend shelf life or enhance flavor. Canned tomatoes in brine, cheese, smoked fish, and simple whole-grain bread belong here. Most retain meaningful nutritional value.
Group 4 — Ultra-processed foods (UPF): Industrial formulations that contain little or no whole food. They typically include ingredients not found in a home kitchen — emulsifiers, flavor enhancers, colorants, and hydrogenated fats. Packaged snack cakes, reconstituted meat products, and sweetened carbonated beverages are classic examples.
| Criterion | Whole / Minimally Processed | Ultra-Processed |
|---|---|---|
| NOVA Group | Groups 1–2 | Group 4 |
| Ingredient list | Short, recognizable items | Long, includes additives |
| Nutrient density | Generally high | Generally low |
| Fiber content | Often significant | Typically minimal |
| Added sugar & sodium | Little to none | Often high |
| Convenience | Moderate (some prep required) | High (ready-to-eat) |
| Chronic disease association | Inversely associated in research | Positively associated in research |
What the Evidence Says About Each End of the Spectrum
Research into ultra-processed food consumption has grown substantially over the past decade. Large observational studies — including cohorts published in journals such as The BMJ and JAMA Internal Medicine — have associated higher UPF intake with increased risk of cardiovascular disease, type 2 diabetes, obesity, and certain cancers. It is important to note these are associations observed in population data, not proof of direct causation for any individual, and the research field is still maturing.
Proposed mechanisms include the displacement of nutritious foods, engineered hyperpalatability encouraging overconsumption, altered gut microbiome composition from emulsifiers, and the cumulative effects of high added sugar and sodium loads.
~57%
Share of calories from UPFs in US diets
A study published in BMJ Open estimated that ultra-processed foods account for roughly 57% of total daily energy intake among US adults.
10% more UPF
Associated CVD risk increase
A large French NutriNet-Santé cohort study found each 10-percentage-point increase in UPF dietary share was associated with a roughly 12% higher risk of cardiovascular disease.
4 groups
NOVA food classification levels
The NOVA system, developed at the University of São Paulo, organizes all foods into four groups based on degree and purpose of industrial processing.
By contrast, diets rich in whole and minimally processed foods are consistently associated with favorable health outcomes in nutrition research. The Mediterranean and DASH dietary patterns — both built around Group 1 and Group 3 foods — have substantial evidence linking them to better cardiovascular and metabolic health. For a deeper look at how individual macronutrients within those foods are evaluated, see our guide to dietary fats and our comparison of plant and animal proteins.
This article is for general informational and educational purposes only and is not a substitute for personalized medical or nutritional advice. Consult a qualified healthcare professional or registered dietitian before making significant dietary changes.